IELTS Writing: Numbers and Pie Charts สาธารณะ

ประเภท:
ลักษณะ:
Taking the IELTS? In this video, I will teach you key vocabulary that will help you get a better score on the writing section of the IELTS. To make things easy for you, Ill teach you impressive academic vocabulary and give you sentences you can use to describe numbers, percentages, and fractions. Youll learn what IELTS examiners are looking for, and what you need to write to get a high band. Well practice analyzing and describing pie charts so you know exactly what to do when you take your test! Continue your IELTS preparation with many other free IELTS lessons at https://www.youtube.com/playlist?list=PLaNNx1k0ao1v8I2C8DAxXOayC3dG00xtj
Test your understanding of this video with my quiz at http://www.engvid.com/ielts-writing-numbers-and-pie-charts/
More free IELTS tips and training:
http://www.goodluckielts.com
TRANSCRIPT
Hi there. My name is Emma, and in todays video, I am going to talk a lot about the IELTS test, specifically writing task one. Im going to teach you about a certain thing you might see on the IELTS, and thats a pie chart. Im going to explain what a pie chart is, and ways to talk about pie charts in order to improve your vocabulary mark for the IELTS.
Many students get really, really confused when they see graphs on the IELTS, and they get really confused trying to talk about numbers, specifically. So, in this video, Im also going to talk about: How do we describe numbers when were looking at pie charts? How do we describe percentages? You know, and how can we make our vocabulary very varied? Okay? So, lets get started.
The first thing I want to do is talk about: What is a pie chart? So, I have here three different types of graphs. Three different graphs you might see on the IELTS, in the writing section, in the very first part of the writing section. Okay? You might see a picture like this, like this, or like this. So, one of these looks like a pie, something you eat. Which one do you think looks the most like pie? If you said this one, you are correct. This is what we are going to be talking about today. We can call it either a "pie chart" or a "pie graph". Both are correct. You might also see this one, this one is called a line graph; or you might see this, which is called a bar graph. So, let me write that on the board. So, "pie chart", "line graph", and "bar graph". You might also see a process, a diagram, or maybe even a table on the IELTS. But for today, we are only going to be focusing on pie charts.
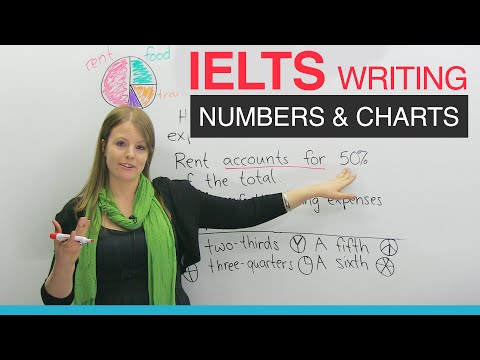
Okay, so what is a pie chart? A pie chart shows us percentages. Okay? So, if we look down here, I have here what I spend my money on. Okay? I want you to imagine each month, all the money I make, all my salary, this is what I spend it on. I spend some of it on rent, I spend some of it on food, I spend some of it on transport or transportation, and I spend some of it on fun. Okay? So, on the IELTS, you might have to describe something like this. It might be more complicated. Sometimes you might actually have two pie graphs or pie charts that you might have to compare and describe, but in this case, lets start out a little bit easier.
So, I want you to imagine youre writing the IELTS, and youve been told to describe this pie chart. What are you going to say about it? Okay? Well, the very first thing you should do is you should think about: What does it all mean? And by that, I mean: Think about how much percent is each thing? Okay? So, for example, for cost of living, how much is this? What size does this look like? Although we cant be sure, because Im not the best artist and this is not a perfect circle, I would say this is about 50%. Okay? And this, what does it look like to you? Maybe 25%. So, food is around 25%. Transport we might say... Lets say 15%. And fun, maybe 10%. Although, were not sure. So, on the IELTS you might see something like this. You might actually have the percentages written, so you already know what it is, or you might actually have numbers. Okay? So, this might actually be money, and so it might actually say, like, $500 to rent, $200 to food, and so forth. Okay, but the first thing to do is really think about: What are the percentages, here?
Okay, so to begin a sentence when were talking about the pie chart, these are three different sentences that are very great... Really, really good sentences to use on the IELTS when youre talking about pie graphs. The first one is: "According to the chart", you can also say: "We can see from the chart", or "We can see from the pie chart", "The chart shows that", okay? So these are good ways to open up the sentence, and then to actually talk about what you see here.
Test your understanding of this video with my quiz at http://www.engvid.com/ielts-writing-numbers-and-pie-charts/
More free IELTS tips and training:
http://www.goodluckielts.com
TRANSCRIPT
Hi there. My name is Emma, and in todays video, I am going to talk a lot about the IELTS test, specifically writing task one. Im going to teach you about a certain thing you might see on the IELTS, and thats a pie chart. Im going to explain what a pie chart is, and ways to talk about pie charts in order to improve your vocabulary mark for the IELTS.
Many students get really, really confused when they see graphs on the IELTS, and they get really confused trying to talk about numbers, specifically. So, in this video, Im also going to talk about: How do we describe numbers when were looking at pie charts? How do we describe percentages? You know, and how can we make our vocabulary very varied? Okay? So, lets get started.
The first thing I want to do is talk about: What is a pie chart? So, I have here three different types of graphs. Three different graphs you might see on the IELTS, in the writing section, in the very first part of the writing section. Okay? You might see a picture like this, like this, or like this. So, one of these looks like a pie, something you eat. Which one do you think looks the most like pie? If you said this one, you are correct. This is what we are going to be talking about today. We can call it either a "pie chart" or a "pie graph". Both are correct. You might also see this one, this one is called a line graph; or you might see this, which is called a bar graph. So, let me write that on the board. So, "pie chart", "line graph", and "bar graph". You might also see a process, a diagram, or maybe even a table on the IELTS. But for today, we are only going to be focusing on pie charts.
Okay, so what is a pie chart? A pie chart shows us percentages. Okay? So, if we look down here, I have here what I spend my money on. Okay? I want you to imagine each month, all the money I make, all my salary, this is what I spend it on. I spend some of it on rent, I spend some of it on food, I spend some of it on transport or transportation, and I spend some of it on fun. Okay? So, on the IELTS, you might have to describe something like this. It might be more complicated. Sometimes you might actually have two pie graphs or pie charts that you might have to compare and describe, but in this case, lets start out a little bit easier.
So, I want you to imagine youre writing the IELTS, and youve been told to describe this pie chart. What are you going to say about it? Okay? Well, the very first thing you should do is you should think about: What does it all mean? And by that, I mean: Think about how much percent is each thing? Okay? So, for example, for cost of living, how much is this? What size does this look like? Although we cant be sure, because Im not the best artist and this is not a perfect circle, I would say this is about 50%. Okay? And this, what does it look like to you? Maybe 25%. So, food is around 25%. Transport we might say... Lets say 15%. And fun, maybe 10%. Although, were not sure. So, on the IELTS you might see something like this. You might actually have the percentages written, so you already know what it is, or you might actually have numbers. Okay? So, this might actually be money, and so it might actually say, like, $500 to rent, $200 to food, and so forth. Okay, but the first thing to do is really think about: What are the percentages, here?
Okay, so to begin a sentence when were talking about the pie chart, these are three different sentences that are very great... Really, really good sentences to use on the IELTS when youre talking about pie graphs. The first one is: "According to the chart", you can also say: "We can see from the chart", or "We can see from the pie chart", "The chart shows that", okay? So these are good ways to open up the sentence, and then to actually talk about what you see here.


5 yปี