IELTS Writing Task 1: How to describe BAR GRAPHS สาธารณะ

ประเภท:
ลักษณะ:
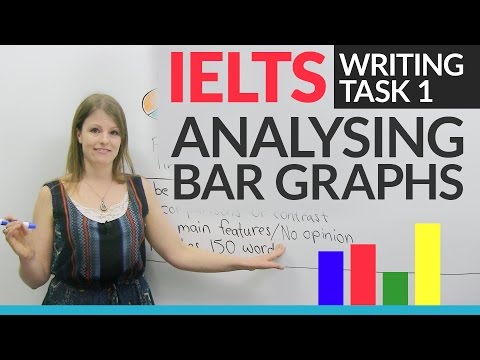
Are you preparing for the writing section of the IELTS? In this lesson, we will look at Writing Task 1, and I will teach you how to describe a bar graph. This is one question type that can be on the IELTS, so it is a good idea to prepare yourself for it. I will take you through what happens in Writing Task 1, what key grammar you can use for it, and how you can improve the organization of your description by using compare-and-contrast vocabulary. Good luck on your exam! Try my quiz at the end to practice some of the concepts from this lesson: https://www.engvid.com/ielts-writing-task-1-bar-graphs/
TRANSCRIPT
Hi there. My name is Emma and in todays video were going to talk about the test known as the IELTS. So if you are going to be writing the IELTS, this video is for you. Now, in this video were talking specifically about if youre writing the academic IELTS. If youre, you know, just here for general interest, you can still learn quite a bit from this video because we will be talking about different vocabulary and grammar. So this video can also help you if youre not taking the IELTS also.
Okay, so what are we going to be talking about specifically in this video? Well, if youre taking the IELTS you probably know that theres a writing part of the IELTS. The writing part has two sections, we call them Writing Task 1 and Writing Task 2. In this video Im going to cover a small bit of Writing Task 1. So, in Writing Task 1 youre going to be given some sort of visual image. Okay? So you might see something like this, this, or this. It might be a chart, it might be a table, but youre going to see some sort of visual and you need to describe what youre seeing. So this video... Ive covered different types of Writing Task 1 and Ill talk about the links to some of these other videos at the end, but in this specific video were going to be talking about bar graphs. Okay?
So, first of all: What is a bar graph? Well, so I have here three different types of charts or graphs. We have this one, this one, and this one. This is called a pie chart. Okay? Ive covered this in another video, so if youre interested in learning how to write about pie charts, you can check out that video. But youll notice with a pie chart it looks kind of like a pizza or a pie. Its in a circle and its... Has different colours representing different percents.
We have here, this is called a line graph. So youll notice that theres a line and, you know, sometimes this represents time, sometimes it represents other things, but with a line graph youll notice, like, increases and decreases, but its one connected line. Were not covering either of these in this video.
What were going to be covering is another thing you might see on the IELTS, which is you might be given a picture like this. This is called a bar graph or a bar chart. So we have here these rectangular-shaped things that are each a different colour. These are known as bars. Okay? So, I know a bar is a place you go to buy beer, but in this case a bar is not that, its actually this kind of rectangle on the chart. So, on the IELTS you may get a picture of something like this. You might actually get a picture of two things together, or you might get a picture of something a lot more complicated than this. In this case were going to talk about: What would you do and say, and what are some tips if you get a picture of a bar graph or a bar chart?
Okay, so what are you going to have to do? Specifically theyre going to ask you... After you get a picture like this, theyre going to ask you to describe what you see. Okay? So youre describing the main information. Youre also going to have to maybe make comparisons, say how things are similar or how things are different, which is contrast. So, for example, if this is, you know, different activities, maybe you might say that the red is shopping and the blue is golfing. In this case, shopping is less popular than golfing. Okay? So pretty much you need to compare the different bars and say: What are the same about them? Which ones are similar and which ones are different?
Youre also going to have to report any main features or trends. Okay? So maybe youll see a pattern and youre going to have to write about, you know, some of these main points you see when you look at the visualization. You do not write your opinion. Okay? So if this is a graph on education, maybe this is elementary school, secondary school, university, masters, and like a doctorate or something - you do not write what you think about it. Okay? All you do is in this type of question youre just writing what you see and what it means. Youre not writing your opinion on anything. So you should not write the words: "I think" or "In my opinion", youll actually lose marks for this. So in task 1, no opinion; thats for task 2.
ต่อไป
เล่นอัตโนมัติ


7 yปี